Over the past few months I’ve been working with the Elasticsearch cluster at Automattic. While we monitor longititudinal statics on the cluster through Munin when something is amiss there’s currently not a good place to take a look and drill down to see what the issue is. I use various Elasticsearch plugins however they all have some downsides.
ES Head is fantastic for drilling down into what is happening down to a shard level however its rendering is way to bulky. Once there is over a dozen nodes or indices in a cluster it becomes a scrolling nightmare.
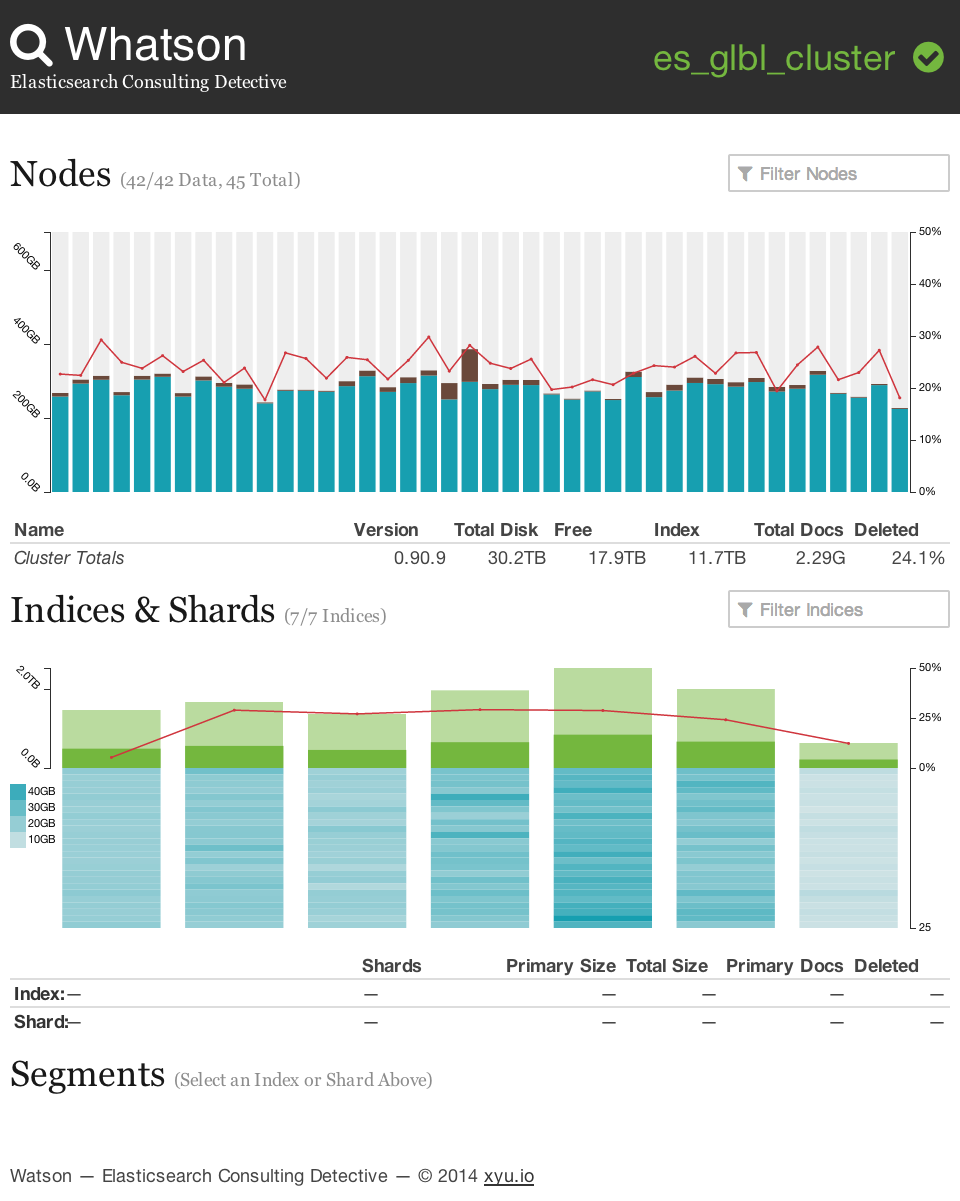
Another tool that I use often SegmentSpy gives lots of info about the underlaying Lucene segments however the use of logarithmically scaled stacked bar charts tends to make it hard to estimate the deleted documents ratio in each shard. In addition it’s hard to drill down to just one shard group to figure out what’s going to happen when nodes restart and shard recovery kicks off on a per segment basis.
I’ve taken all that I wished I could do with both of those plugins and created a new Elasticsearch plugin that I call Whatson. This plugin utilizes the power of D3.js to visualize the nodes, indices, and shards within a cluster. It also allows the drilling down to segment data per index or shard. With the focus on visualizing large clusters and highlighting potential problems within. I hope this plugin helps others find and diagnose issues so give it a try.
2 responses to “Introducing Whatson, an Elasticsearch Consulting Detective”
[…] Greg is not alone! Xiao Yu also recently wrote about the tools he uses, and a plugin he concocted for his own […]
[…] Whatson for looking at shard distribution, disk usage, index size, etc […]